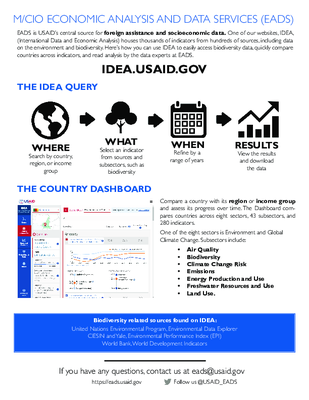
IDEA Country Dashboard

The Dashboard provides the most-up-to-date data across sectors.
USAID M/CIO’s Economic Analysis and Data Services’ (EADS) new Country Dashboard is an interactive data visualization tool that allows USAID staff to compare a country with selected groups of countries and assess its progress over time. The Dashboard compares countries across eight sectors, 43 subsectors, and 280 indicators, all of which are also housed on the International Data and Economic Analysis (IDEA) website.
The Dashboard provides the most-up-to-date data across sectors. It shows selected indicators for countries that USAID assists, benchmarked against regional data or data for countries of similar income. Users can compare country values with income groups and regional averages, or view the trend line and ranking of a specific indicator.
Data on the Country Dashboard has been organized into eight sectors related to USAID’s work around the world. These sectors are:
- Hunger and Food Security
- Economy
- Education
- Gender
- Health
- Trade and Investment
- Democracy, Human Rights, and Governance
- Environment and Global Climate Change
The Country Dashboard will be available to the public, but it is mainly produced for USAID and their development partners. The Dashboard will empower USAID staff across the Agency throughout the program cycle in planning activities and monitoring country progress.
Indicators, sectors, and subsectors on the Country Dashboard were chosen based on intensive research into USAID’s policy goals and strategic planning resources. The sectors and indicators on the Country Dashboard have been carefully chosen after meeting with USAID sector and regional experts across the Agency. With that in mind, if there is an indicator you think we should include, please let us know at eads@usaid.gov.


